
Trading Trends and Insights
Explore Expert Insights and in-depth articles
on the latest developments in commodity testing
Day over Day PnL Attribution
Explained PnL and Controlled PnL Management
RightAngle does many things well. Producing an explained daily PnL is not one of them. At best, when curves are configured correctly, deals are entered correctly, and orders are scheduled correctly, RightAngle produces an MTM report that can be exported to Excel for an analyst to review and make their own deductions on why there was a change in PnL day-over-day. Out of the box, however, RightAngle does not explain the day-over-day changes in MTM or provide a controlled process for reviewing and locking down daily PnL.
Manning Software has built Pyvotl as a sidecar application within RightAngle to address these limitations. Pyvotl compares the two most recent nightly snapshots and automatically buckets every dollar of day-over-day PnL movement into meaningfulcategories, including curve shift, new deals, secondary costs, and changeddeals. Each category can be further broken down into subcategories, such asdeleted positions, deal price changes, actualization, and curve configuration changes inside of the changed deals bucket.
Another significant limitation of the standard RightAngle MTM process is that historical snapshot data is not inherently locked down. Curve configuration changes and manual adjustments can alter historical data, making it difficult to reconcile prior snapshots and maintain an accurate MTD and YTD PnL. Pyvotl provides a controlled workflow for reviewing and locking daily PnL. After the nightly snapshot runs, the Pyvotl PnL reports are automatically generated and are ready for review before the analyst begins their day. The reports are initially assigned a status of Preliminary, indicating that the PnL is available for review. Once the analyst completes their review and makes any necessary adjustments, the PnL can be moved to Finalized. This status indicates that the analyst has completed their review and the PnL is ready for review by the trader or manager.
The workflow can be managed at any level, from an individual strategy through the entire portfolio. Once a report is moved to Finalized,the underlying data is locked. Any further changes require the report to be rolled back to Preliminary, the necessarychanges to be made, and the report to be finalized again. Once the PnL for the entire book has been reviewed and agreed upon, the report is moved from Finalized to Published, permanently locking the snapshot data. Any issues identified after publicationare addressed in the following day's PnL rather than modifying historical results.
PnL Adjustments
Errors in deal entry, scheduling, missing prices, or other issues can occasionally result in incorrect MTM and require a PnL adjustment. Pyvotl includes a dedicated adjustment screen that integrates directly with the PnL reporting workflow and provides three distinct types of adjustments.
Value adjustments correct an error in thevaluation of a position. These adjustments automatically reverse the following day based on the assumption that the underlying issue will be corrected.
Attribution adjustments do not change the total PnL reported for the day. Instead, they move PnL between attribution buckets.For example, a $50,000 adjustment could move $50,000 from New Deals to CurveShift while leaving total daily PnL unchanged.
Permanent adjustments make a lasting change to reported PnL and do not automatically reverse. These adjustments are typicallyrestricted to risk management leadership, helping prevent analysts fromadjusting PnL to resolve an unexplained result rather than addressing the underlyingissue.
Reporting MTD, YTD, and LTD PnL
After the PnL reports are published each day, the data is extrapolated into the Pyvotl data warehouse. This creates a permanent history of daily PnL and itsunderlying attribution, allowing users to stack each daily change from inception to calculate MTD, YTD, or LTD PnL.
Pyvotl's reporting tools provide the flexibility to analyze PnL at virtually any level of detail—from a high-level portfolio view down to individual deal detail. This ives traders, analysts, and managers a consistent view of not only how much PnL was generated, but also why it changed, where it came from, and how it has accumulated over time
Day over Day Exposure Attibution
Explained Exposure and Position Attribution
Just as traders and risk teams need to understand day-over-day PnL changes, they also need visibility into day-over-day changes in exposure. This includes both flat price and basis exposure.
It is common for a trader to end the day with the expected positions, only to find that exposures have changed overnight. Without the right tools, identifying what changed and why can be difficult and time-consuming. A position may have changed because barrels priced in or out, a new deal was entered, a positionwas deleted, or an existing position was modified.
Manning Software has developed tools that sit inside of RightAngle and automatically explain every day-over-day position change by organizing changes into intuitive attribution buckets. These include Decay—barrels pricing in or out on an index—New Deals, Deleted Positions, Position Changes, and Rack Sales. Position Changes can be further attributed to specific events such as actualization, transfer BAV updates, or changes to pricing days.
Our exposure attribution reports show the prior-day position, current-day position,day-over-day position change, and the reason for the change, with visibility down to the individual transfer. This allows traders and analysts to quickly identify exactly what changed rather than manually comparing positions across two days.
Linking Exposure Changes to PnL
One of the key advantages of the Pyvotl architecture is that exposure attribution and PnL attribution are directly connected through a unique Pyvotl ID. This creates a direct link between a change in position and the resulting change in PnL.
For example, if a position change causes both exposure and PnL to move, the PyvotlID shown on the exposure report can be used to locate the corresponding line item in the PnL report. The PnL report will then show the resulting PnL change within the Changed Deals bucket, providing visibility into both the position change and the PnL generated by that change
This creates a complete audit trail from what changed in the position, why it changed, and what PnL resulted from the change—all within the RightAngle environment.
Early Roll Mechanics
Certain markets, such as the U.S. Gulf Coast gasoline and distillate markets, price physical barrels against underlying NYMEX contracts—RB for gasoline and HO for distillate. At the beginning of each month, physical pricing is based on the first nearby NYMEX contract. However, these markets roll to the second nearby contract partway through the month based on pipeline schedule dates on the Colonial Pipeline.
For example, CBOB in Pasadena, Texas will price against the May RB contract through April 15, then roll to the June RB contract beginning January 16, based on when Colonial pipeline Cycle 25 starts scheduling. Out of the box, RightAngle does not provide a way to reflect these early pricing rolls in exposure or mark-to-market reports. As a result, the underlying NYMEX exposure can be incorrectly attributed to the wrong contract month. This is especially apparent during the RVP changes, where there could be large structure between the months.
Manning Software has developed a process that ties forward curve decomposition to the pipeline schedule dates that determine when physical pricing rolls occur. This allows RightAngle to appropriately decompose physical exposure and mark-to-market values into the correct underlying NYMEX contract month, providing a more accurate representation of both market exposure and valuation.
In the example below, we can see the barrels pricing in for the month of April start pricing against the June RB contract on April 16. The mark-to-market and risk exposure reports will also decompose using the June RB contract upon rolling the Snapshot End of Day to April 16 in RightAngle.

Pipeline Cycle Marks
RightAngle is designed to use monthly delivery periods for physical trades. In the real world, however, U.S. Gulf Coast refined products are traded and delivered based on pipeline cycles—six cycles per month, or 72 cycles per year.
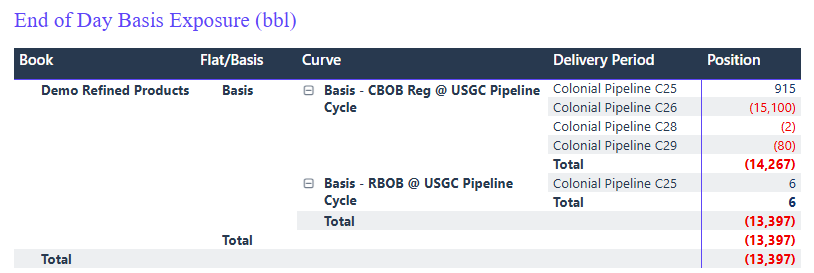
Manning Software has developed custom delivery periods that allow traders and risk analysts to view exposure and mark-to-market by their actual pipeline cycle. For example, if a trader buys six batches of product during a month, with one batch scheduled for each pipeline cycle, RightAngle will typically mark all six transfers against the same monthly price. Our custom process allows each transfer to be marked against the market value of its respective pipeline cycle.
This provides a significantly more accurate representation of market exposure and allows companies to accurately capture basis structures throughout the month. Combined with our early-roll functionality, Manning Software can represent exposure and P&L with 100% accuracy on pipelines such as Colonial.
Pipeline cycle marking also solves a common issue with cycle rolls. When a trader pays to roll a position from one pipeline cycle to another, RightAngle can show the transaction as a loss even when both legs of the roll are executed at their respective market values. In that scenario, the trader should have zero P&L—the value transferred between cycles should offset the cost of the roll. Our custom cycle-based marking process correctly captures the market value of each leg, ensuring P&L reflects the economics of the transaction rather than an artifact of monthly marking.
Compliance Automation
Certain businesses are subject to government compliance obligations, including RVO obligations at refineries, credit generation from blending certain products, and Cap-at-the-Rack and Low Carbon Fuel Standard (LCFS) obligations for rack business.
Manning Software has developed custom code and processes that automatically calculate and record these credit obligations in RightAngle in real time as business activity is recorded. For example, when gasoline and ethanol are blended at a rack in California, the blender detaches the RIN and incurs corresponding CCA and LCFS credit obligations to the State of California.
Out of the box, RightAngle does not provide a mechanism to calculate these obligations in real time. Instead, companies must extrapolate RightAngle data, process it through spreadsheets, and manually update the resulting obligations in RightAngle. This creates timing discrepancies between when cash is collected at the rack and when the corresponding compliance obligation is recognized, requiring the process to be performed daily to maintain accurate positions.
Our custom process eliminates this timing gap by automatically generating additional line items on the truck movement document for each applicable credit obligation. These line items are then automatched to their respective consumption orders, ensuring compliance credit positions remain accurate and up to date. This provides a real-time reflection of both the cash collected at the rack and the corresponding compliance deficit recognized in P&L.